
TECHNOLOGY
Virtual staining generates per-cell biomarker expression from H&E in minutes.
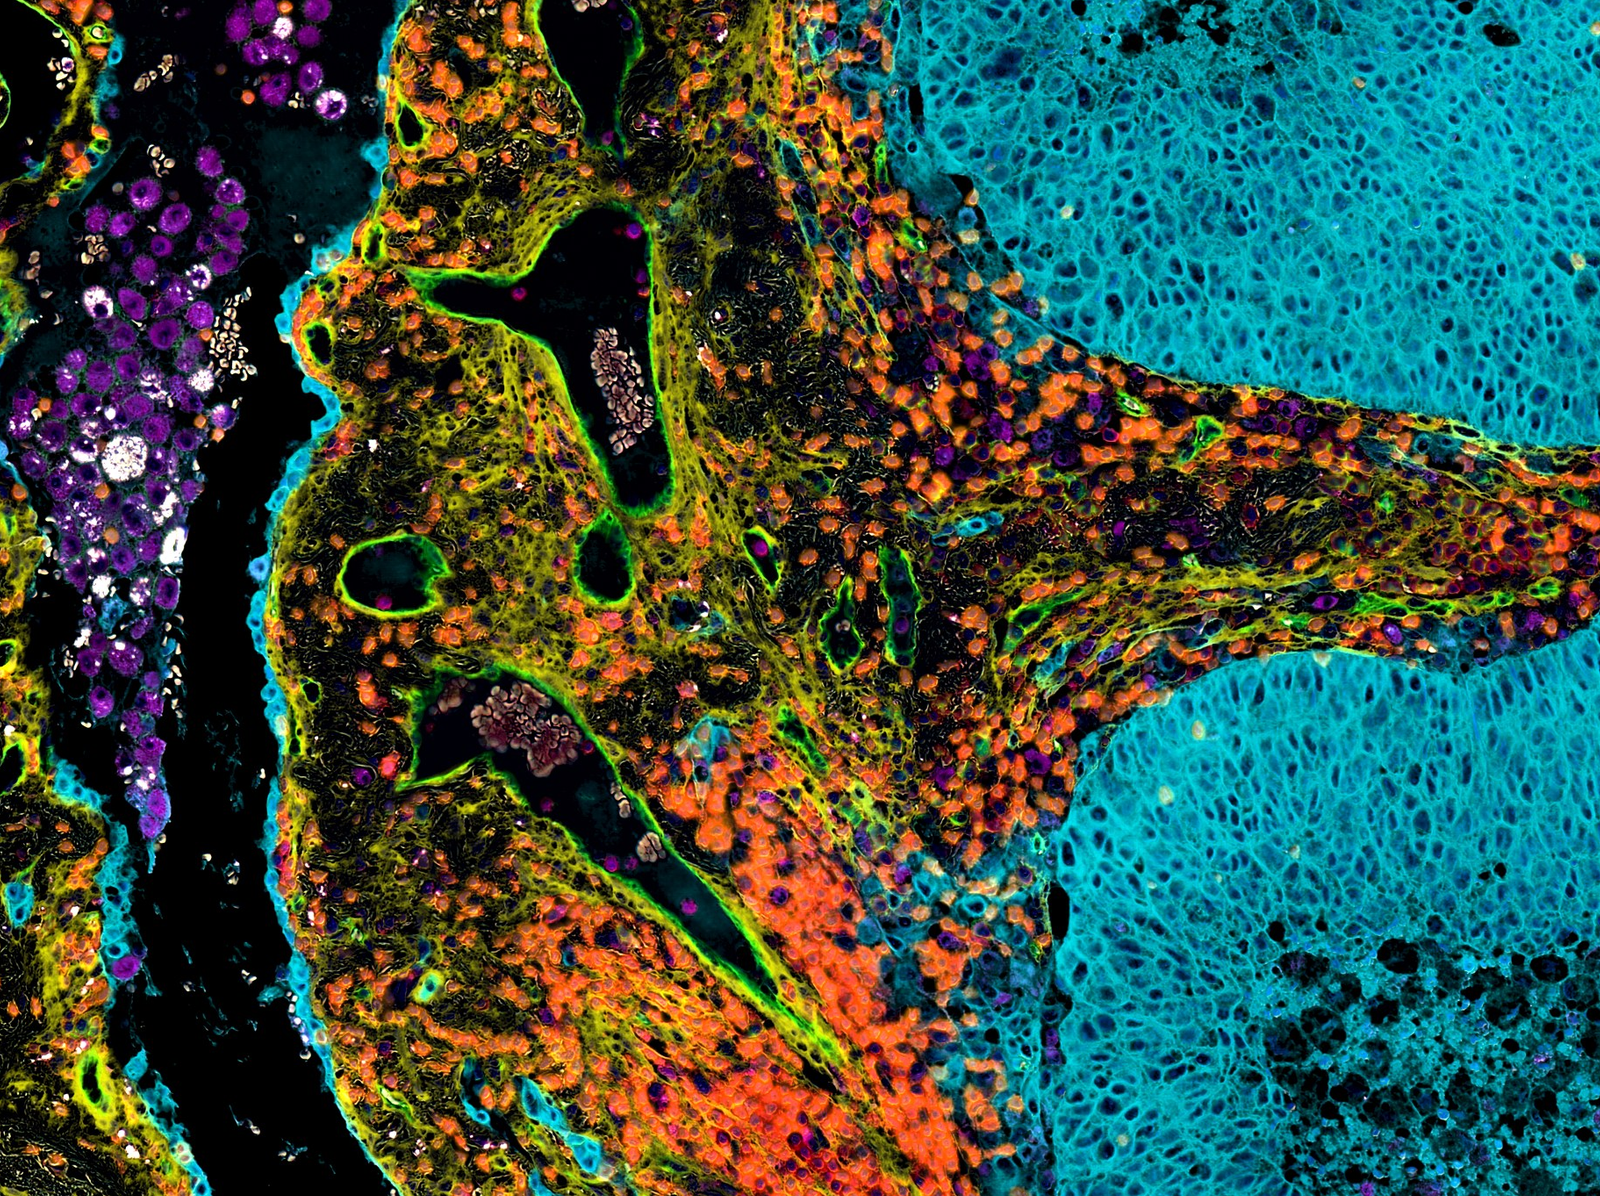
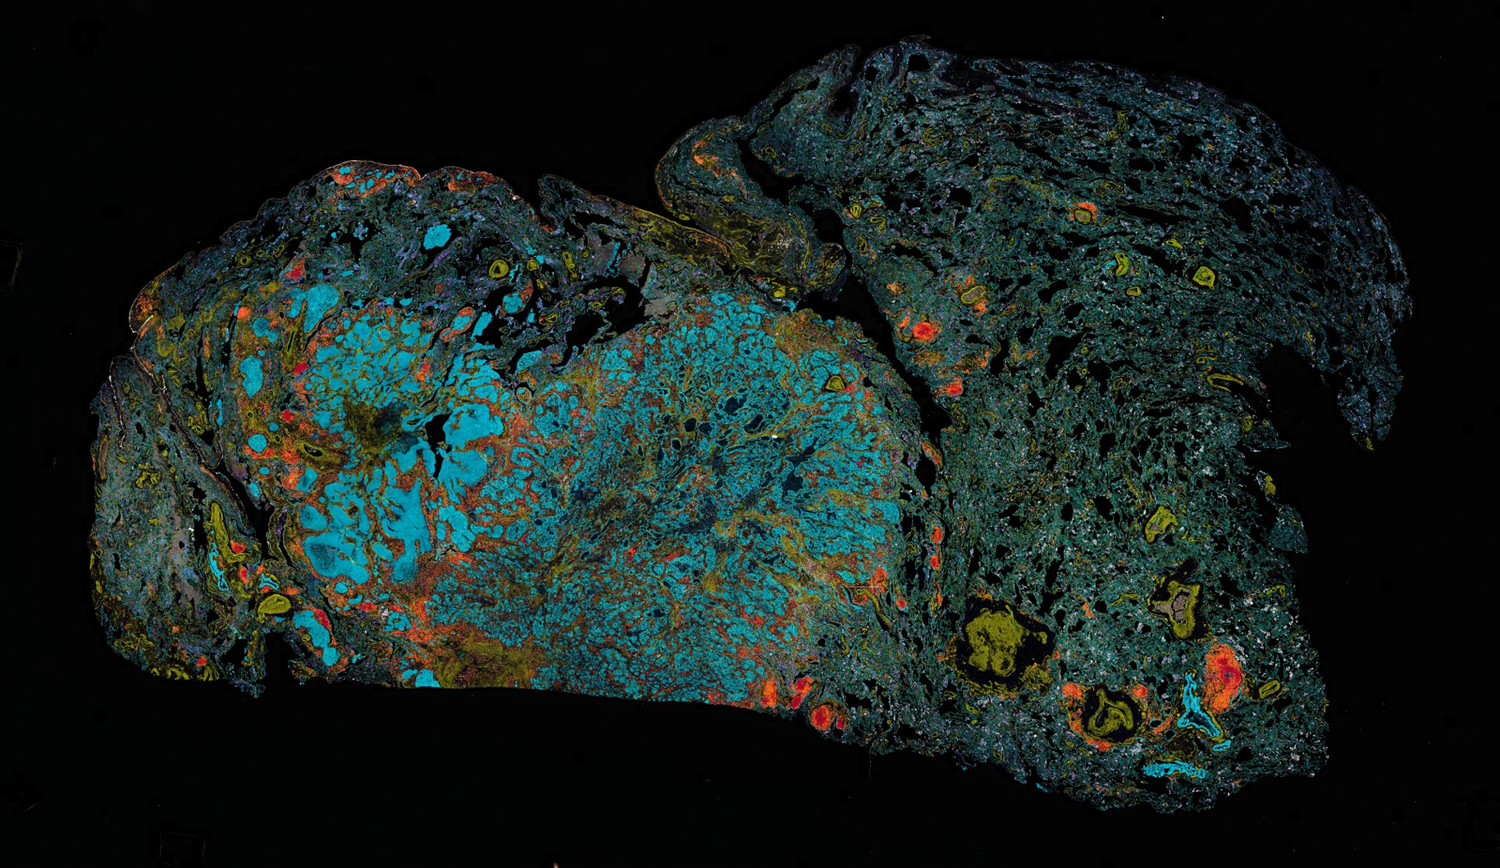
- panCK
- CD45
- CD31
- CD68
- SMA
- CD3
Virtual multiplex immunofluorescence, lung
Generated from H&E whole slide image.
Our platform uses deep learning to virtualize the immunohistochemistry (IHC) process. The result is an IHC image generated computationally from a single H&E whole slide image (WSI) with spatial and per-cell quantitative biomarker expression data.
the PRoblem
Traditional IHC is slow, wet-lab intensive, and consumes tissue.
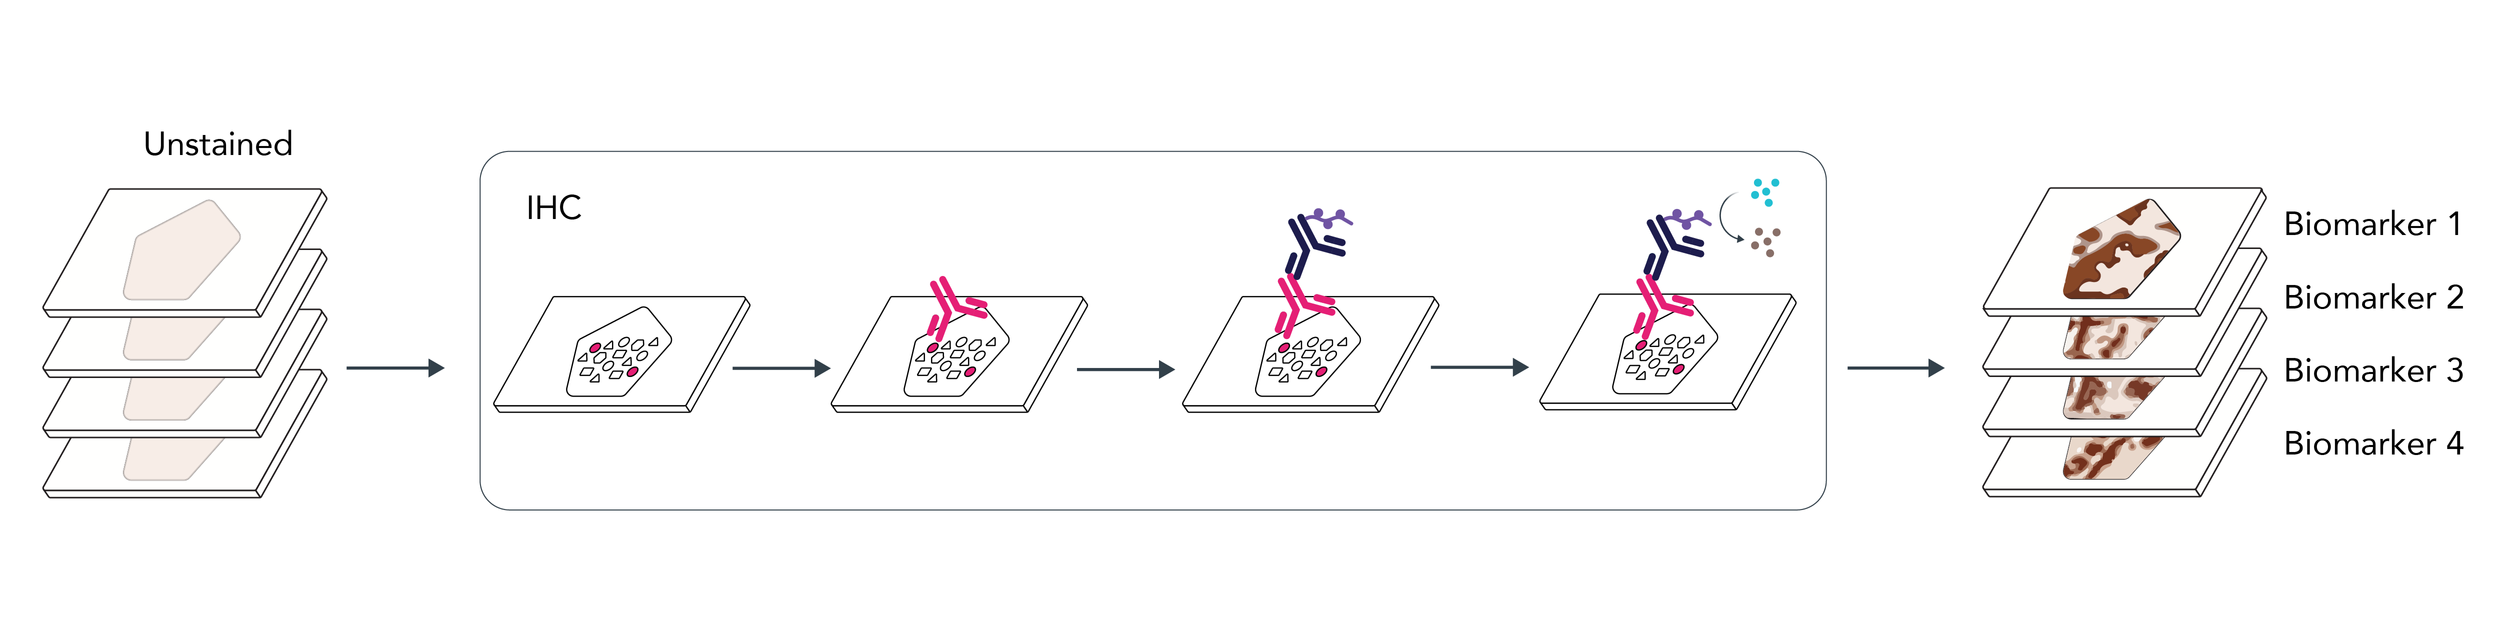
Takes Time
Results can take days to weeks.
Consumes Tissue
Each biomarker consumes another section, leaving less for downstream testing.
Limits Co-expression
Stains on separate sections make cell-level co-expression analysis challenging.
Resists Scale
Multiplex assays are resource-intensive and hard to scale.
the solution
Virtual staining predicts biomarker expression from a single H&E slide.
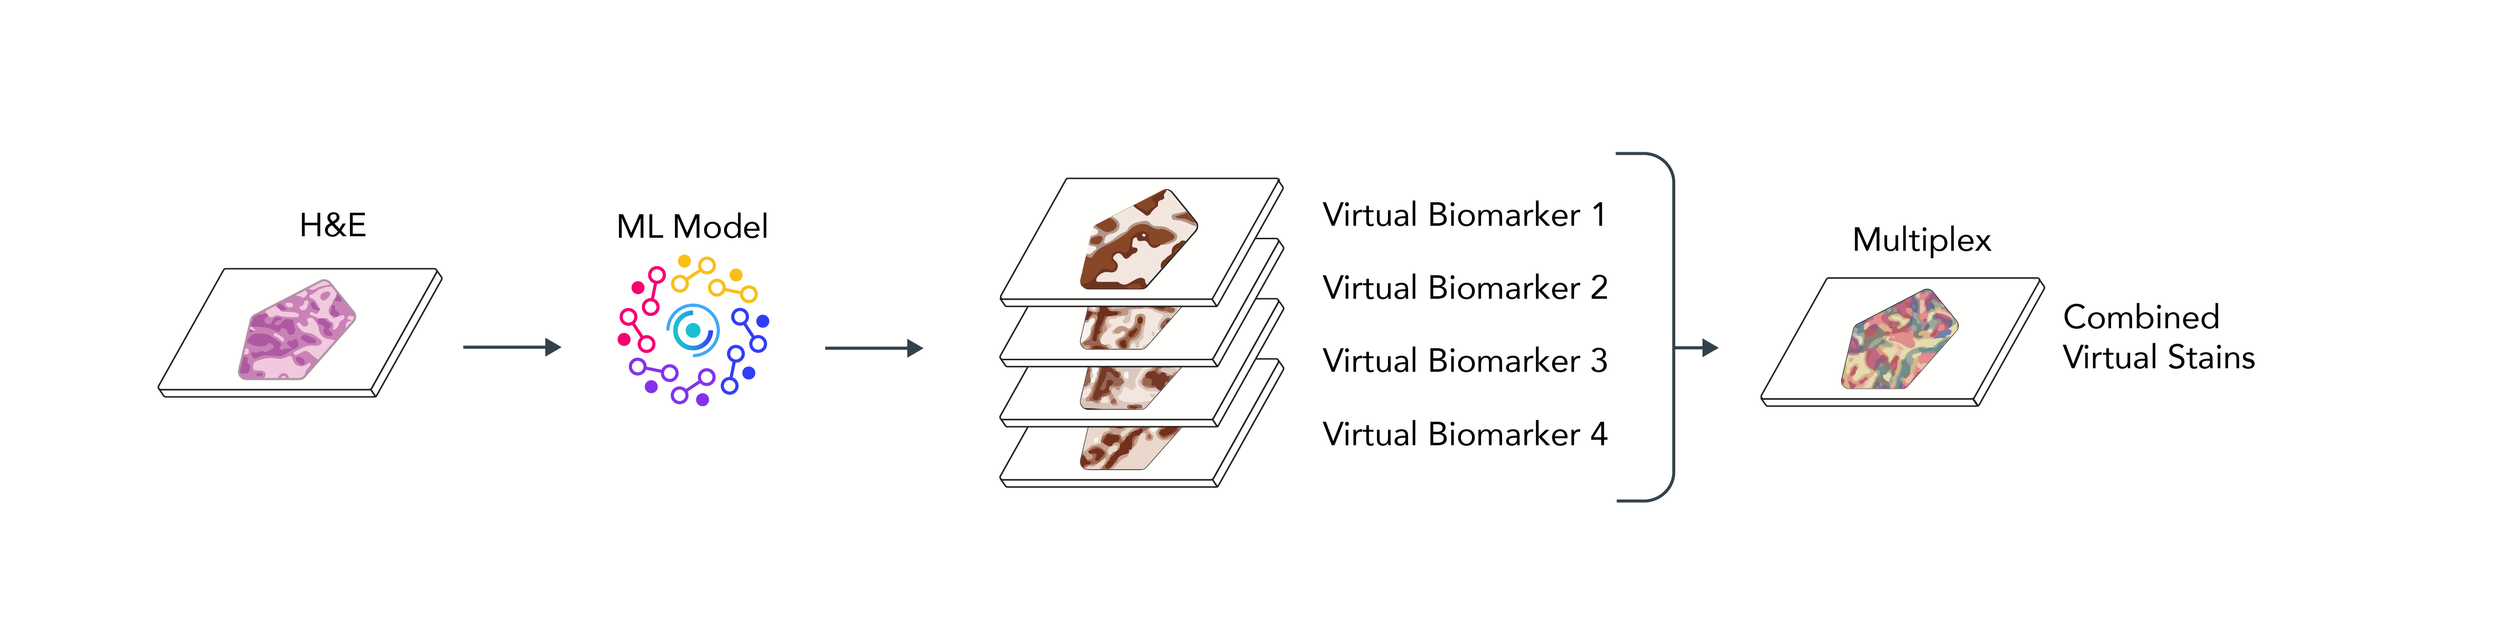
Reduces Turnaround Time
Obtain IHC results in minutes, not days to weeks.
Conserves Tissue
Use the H&E slide you already have. No additional sections required.
Enables Co-Expression
Biomarkers are spatially resolved to the same cells, enabling per-cell co-expression analysis.
Scales Easily
Add virtual biomarkers to a panel without new wet-lab and multiplex protocol development.
How it works
Train on paired H&E and IHC, then generate a virtual IHC from H&E alone.
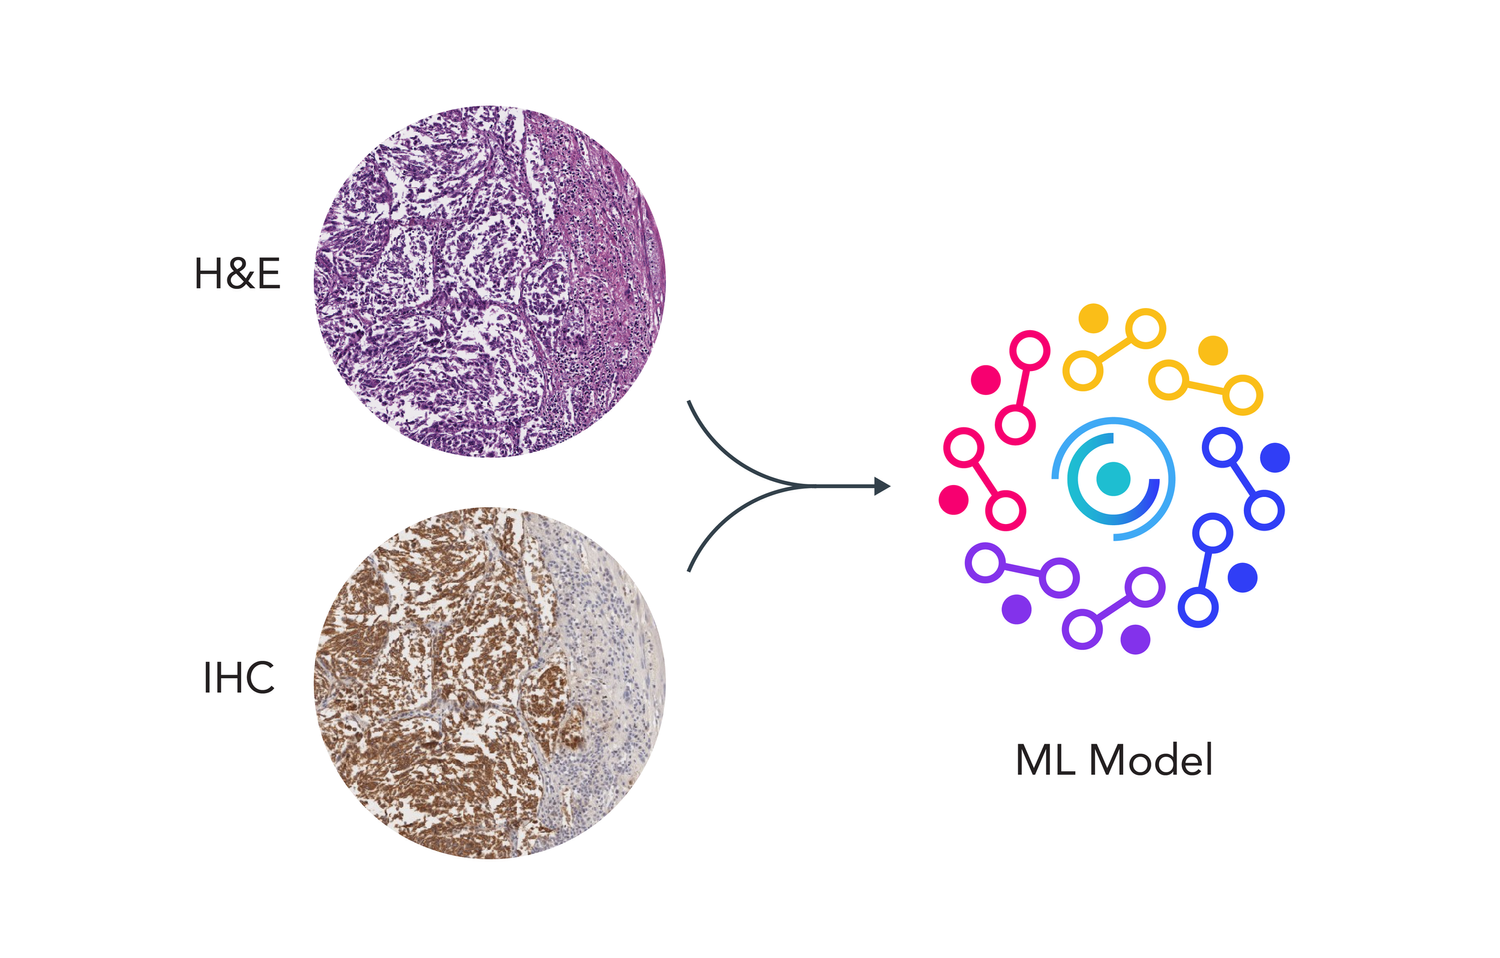
Train
Our platform uses machine learning with paired H&E and IHC images to create a virtual biomarker model.
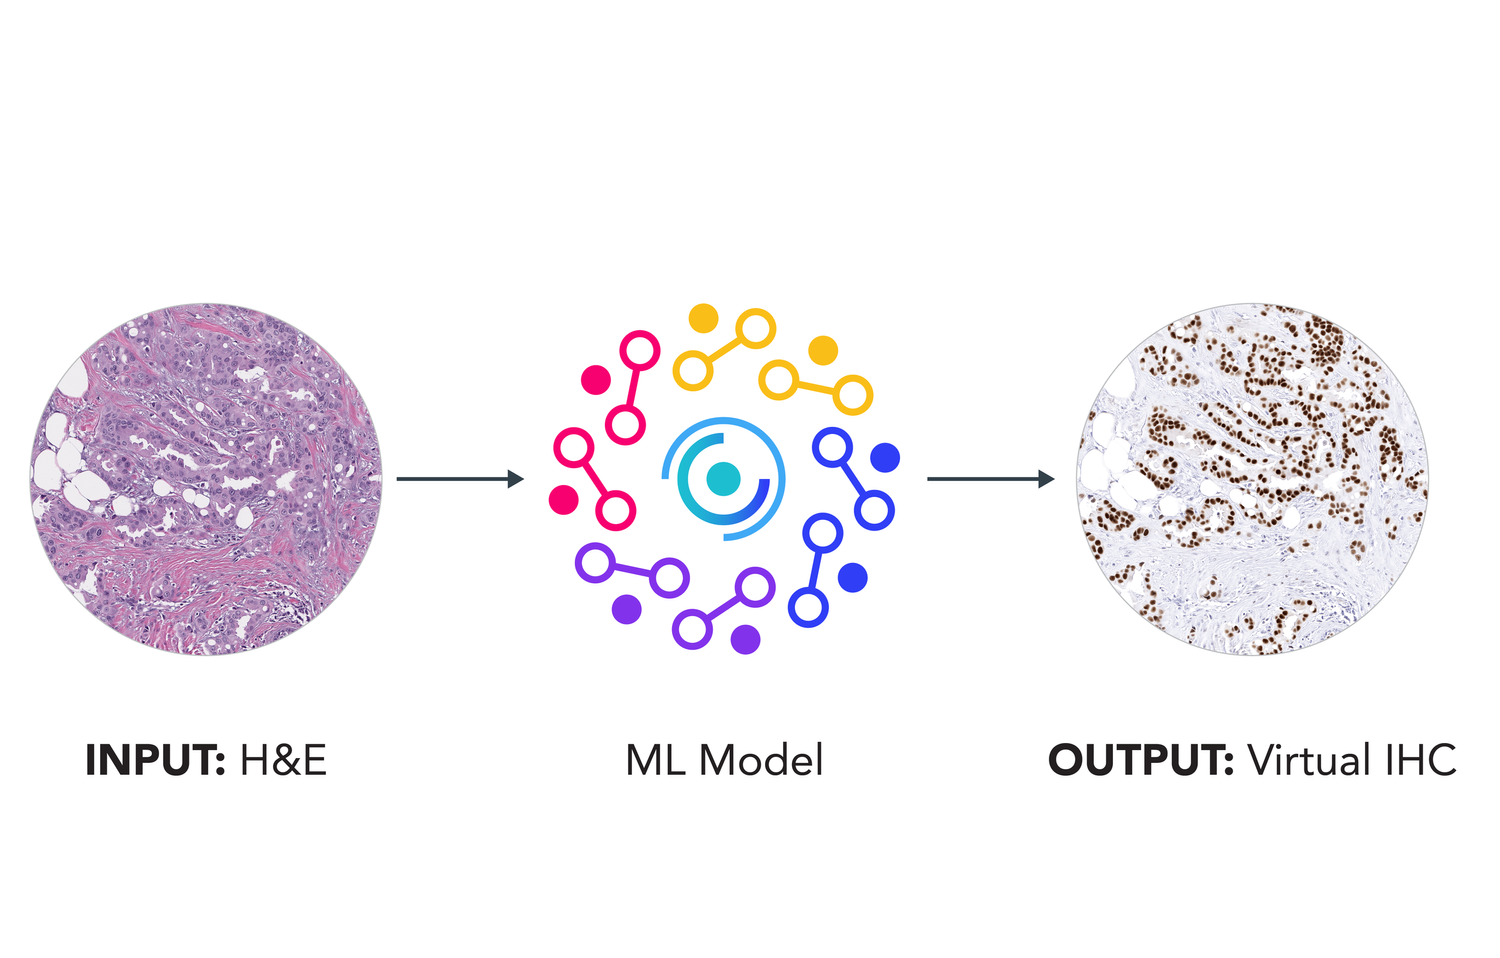
Infer
Once trained, the model generates a virtual IHC for that biomarker directly from the H&E alone, no additional tissue required.
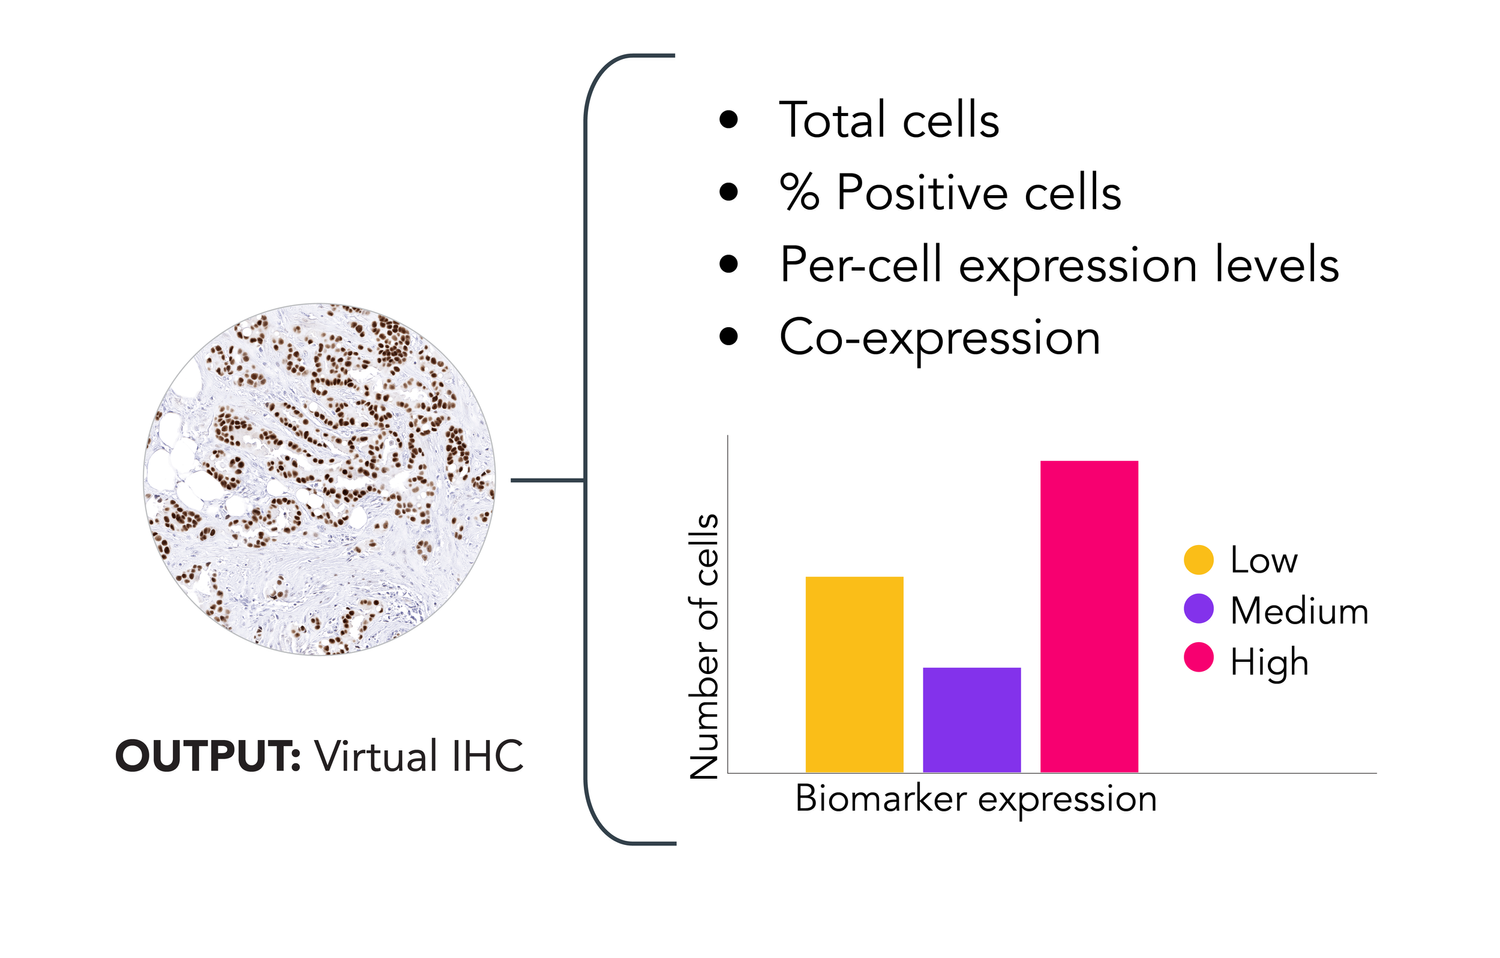
Quantify
Expression is reported per-cell, with spatial localization across the full slide, as a single marker or a multiplex panel.
SAMPLE OUTPUT
From one H&E slide to a full virtual multiplex panel.
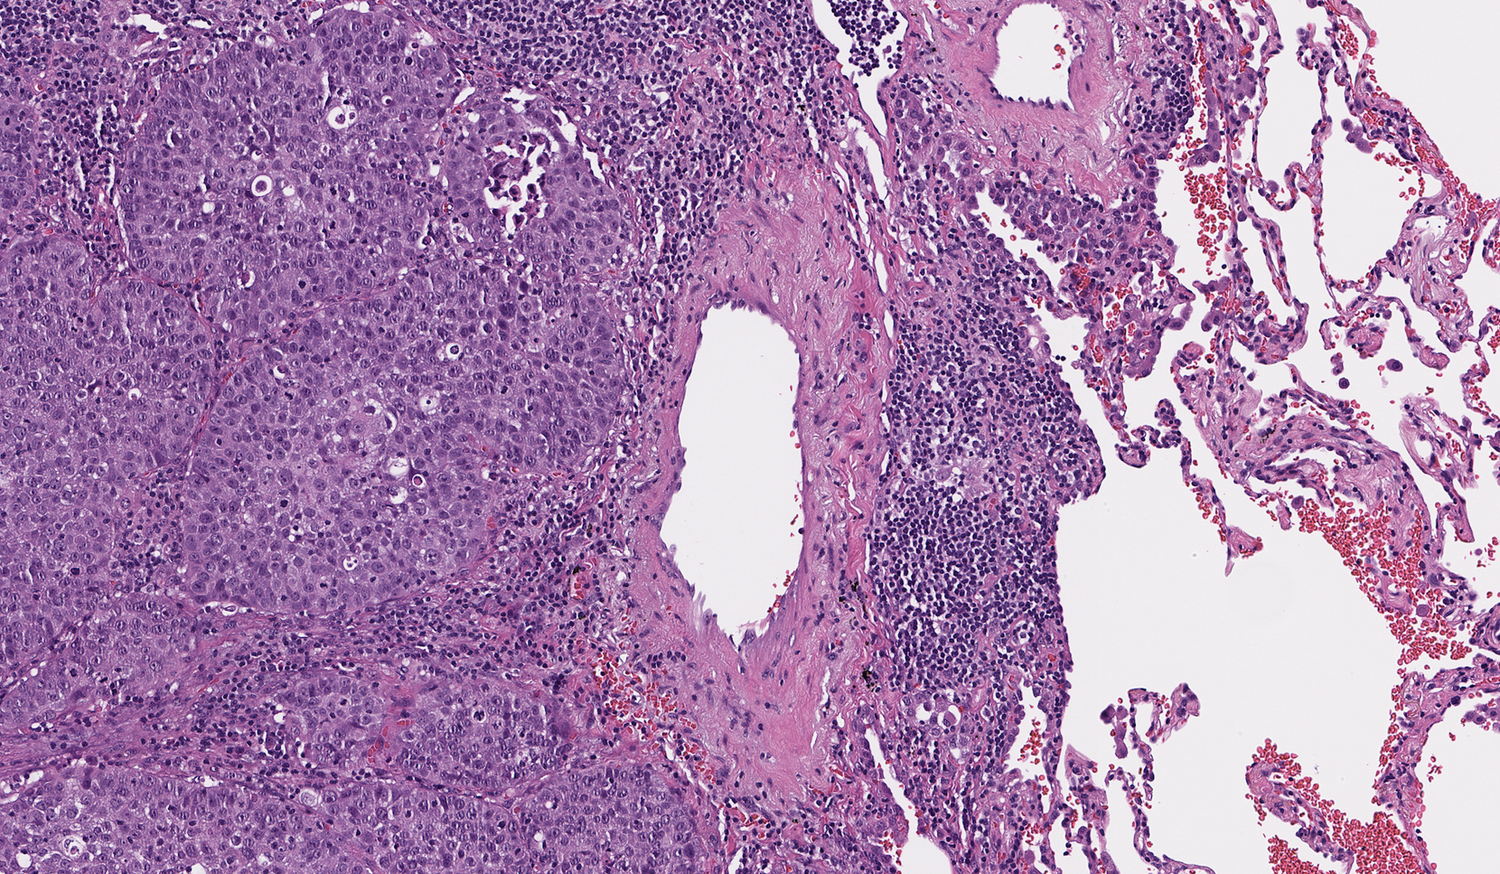
Input H&E whole slide image
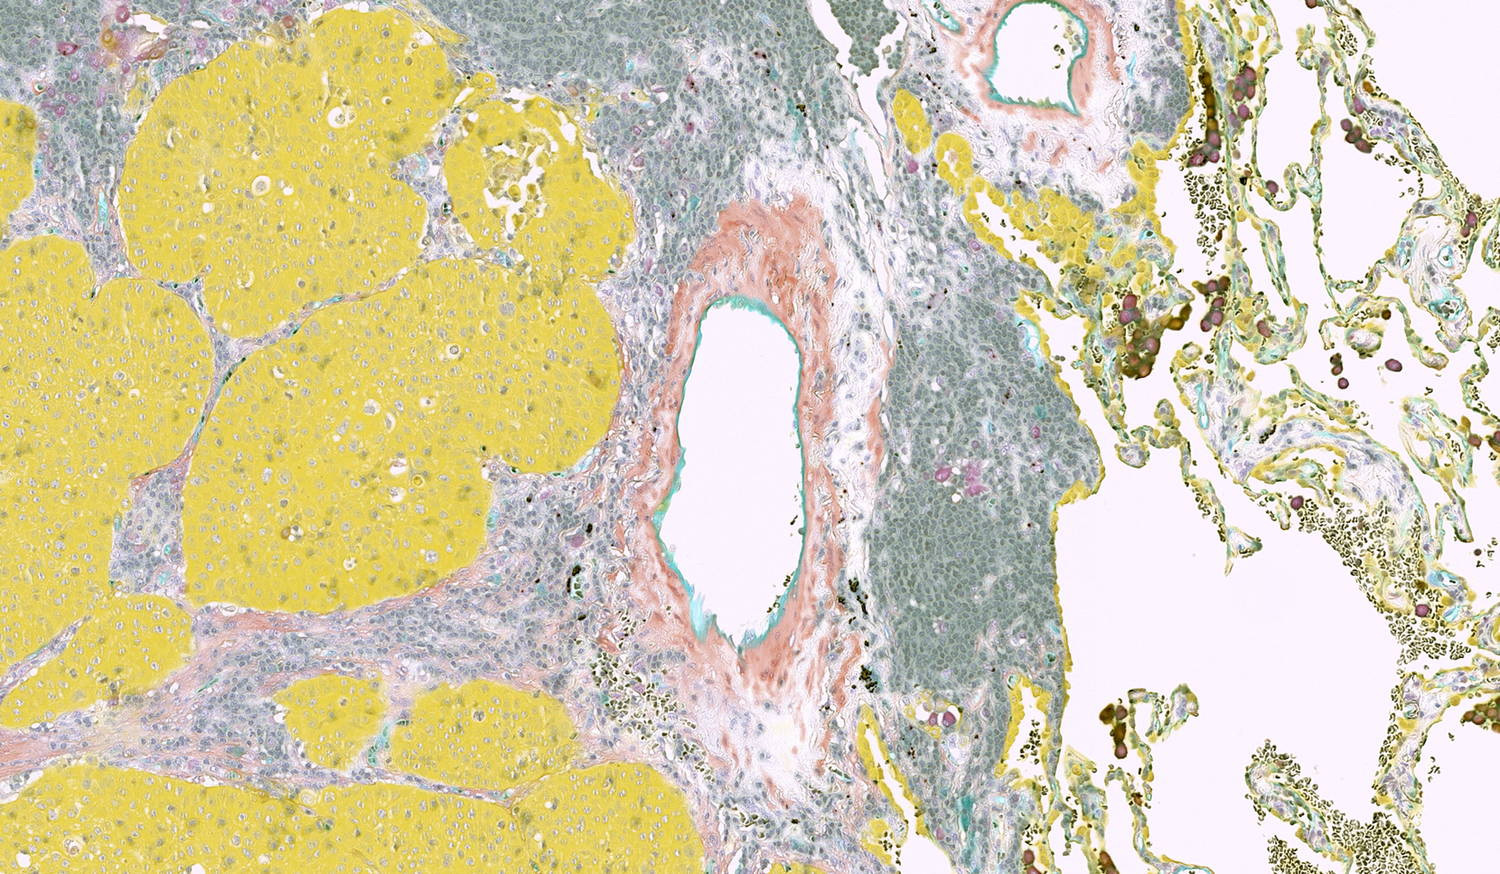
- CD31
- CD45
- CD68
- SMA
- CK
Output virtual multiplex IHC
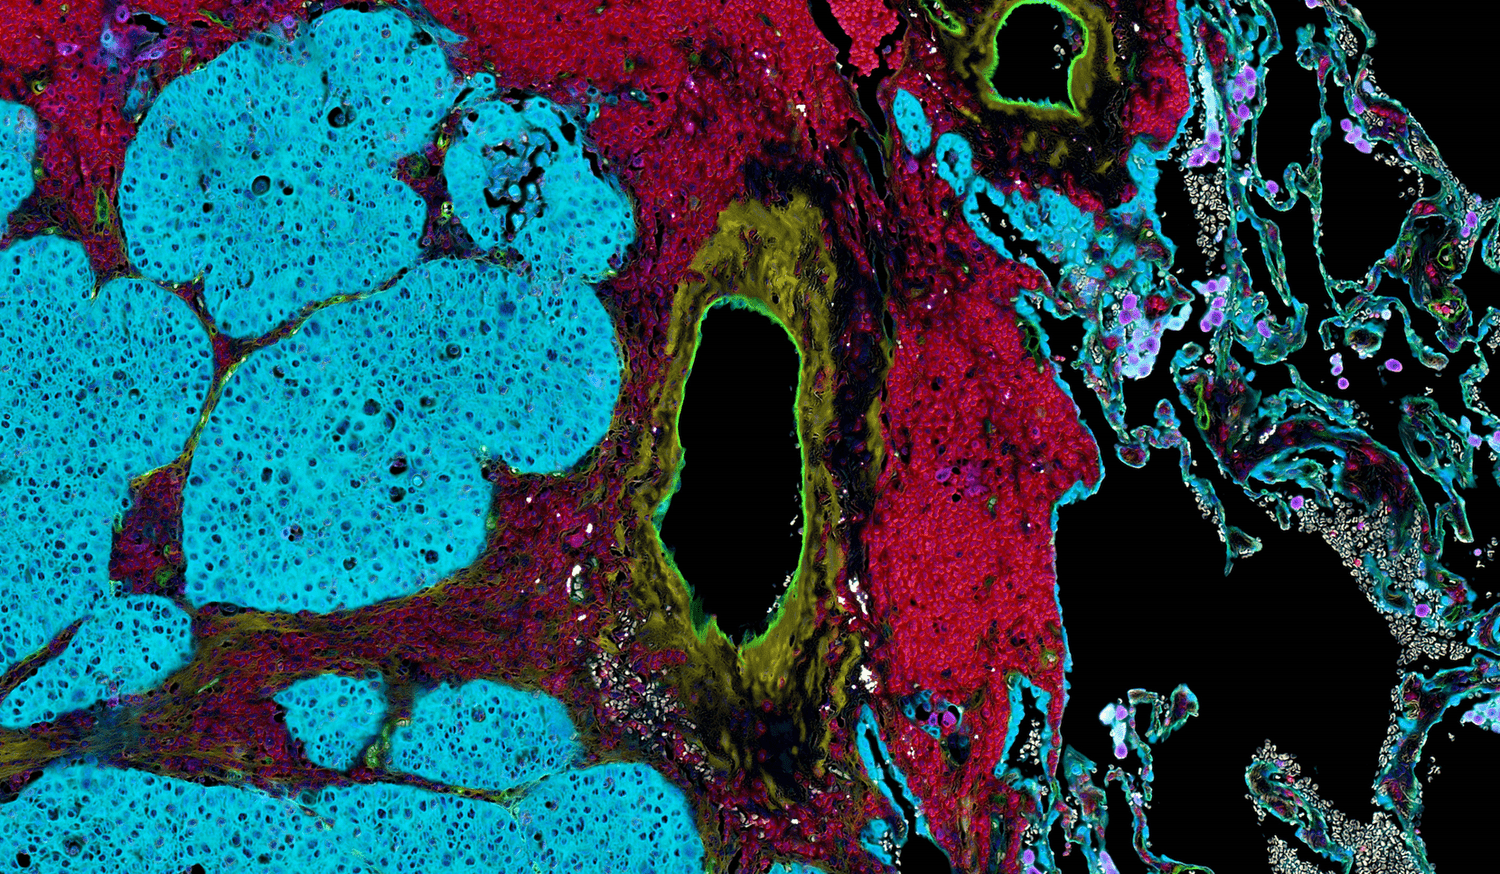
- CD31
- CD45
- CD68
- SMA
- CK
Output virtual multiplex IF
CD31 vasculature · CD45 leukocytes · CD68 macrophages · SMA fibroblasts · CK epithelial cells
Virtual staining unlocks spatial and quantitative insights to biomarker expression. The output can be rendered as a full virtual multiplex or broken out marker by marker, in immunofluorescence (IF) or conventional IHC-like form. This reveals co-expression and spatial distribution across markers from a single slide.
PERFORMANCE
Every virtual biomarker is scored against physical IHC.
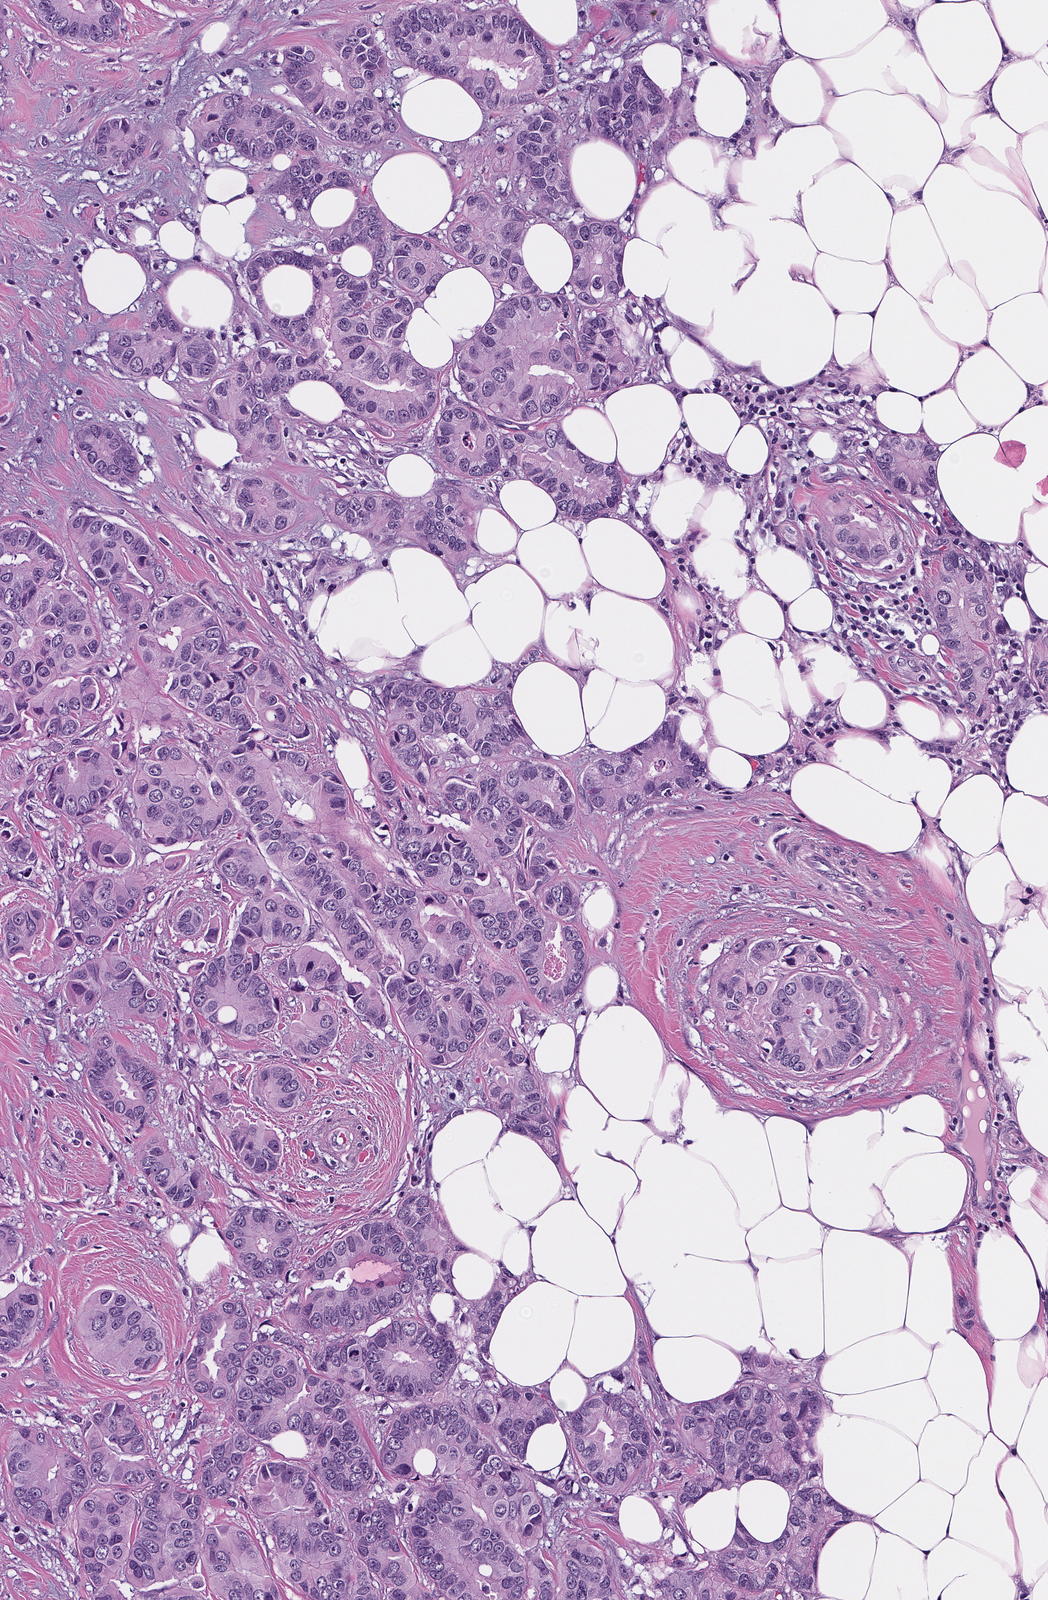
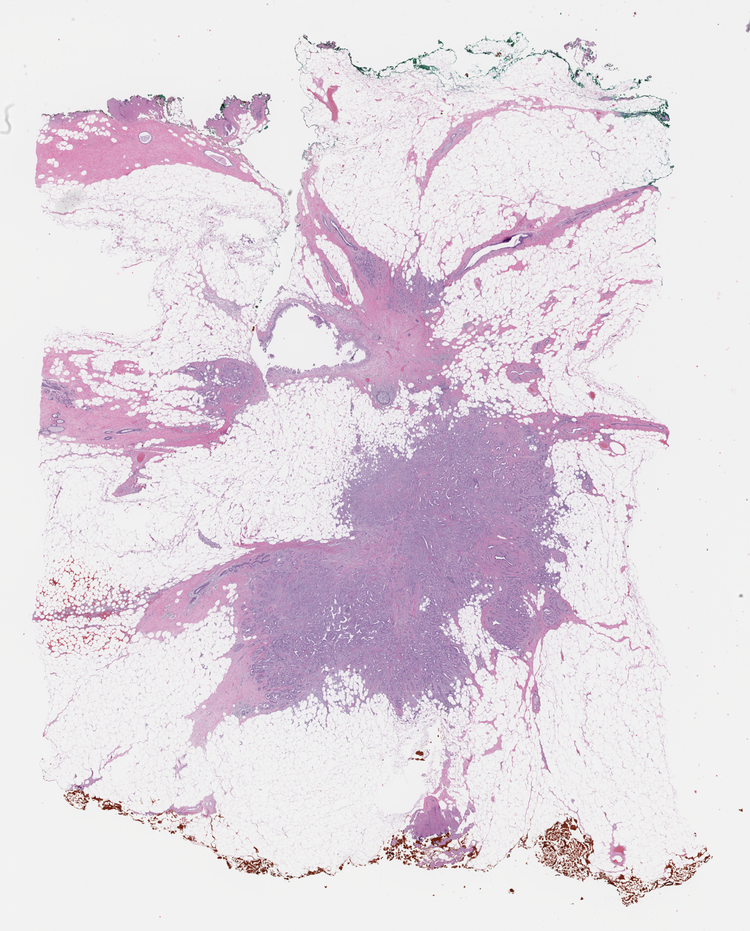
Input
H&E whole slide image.
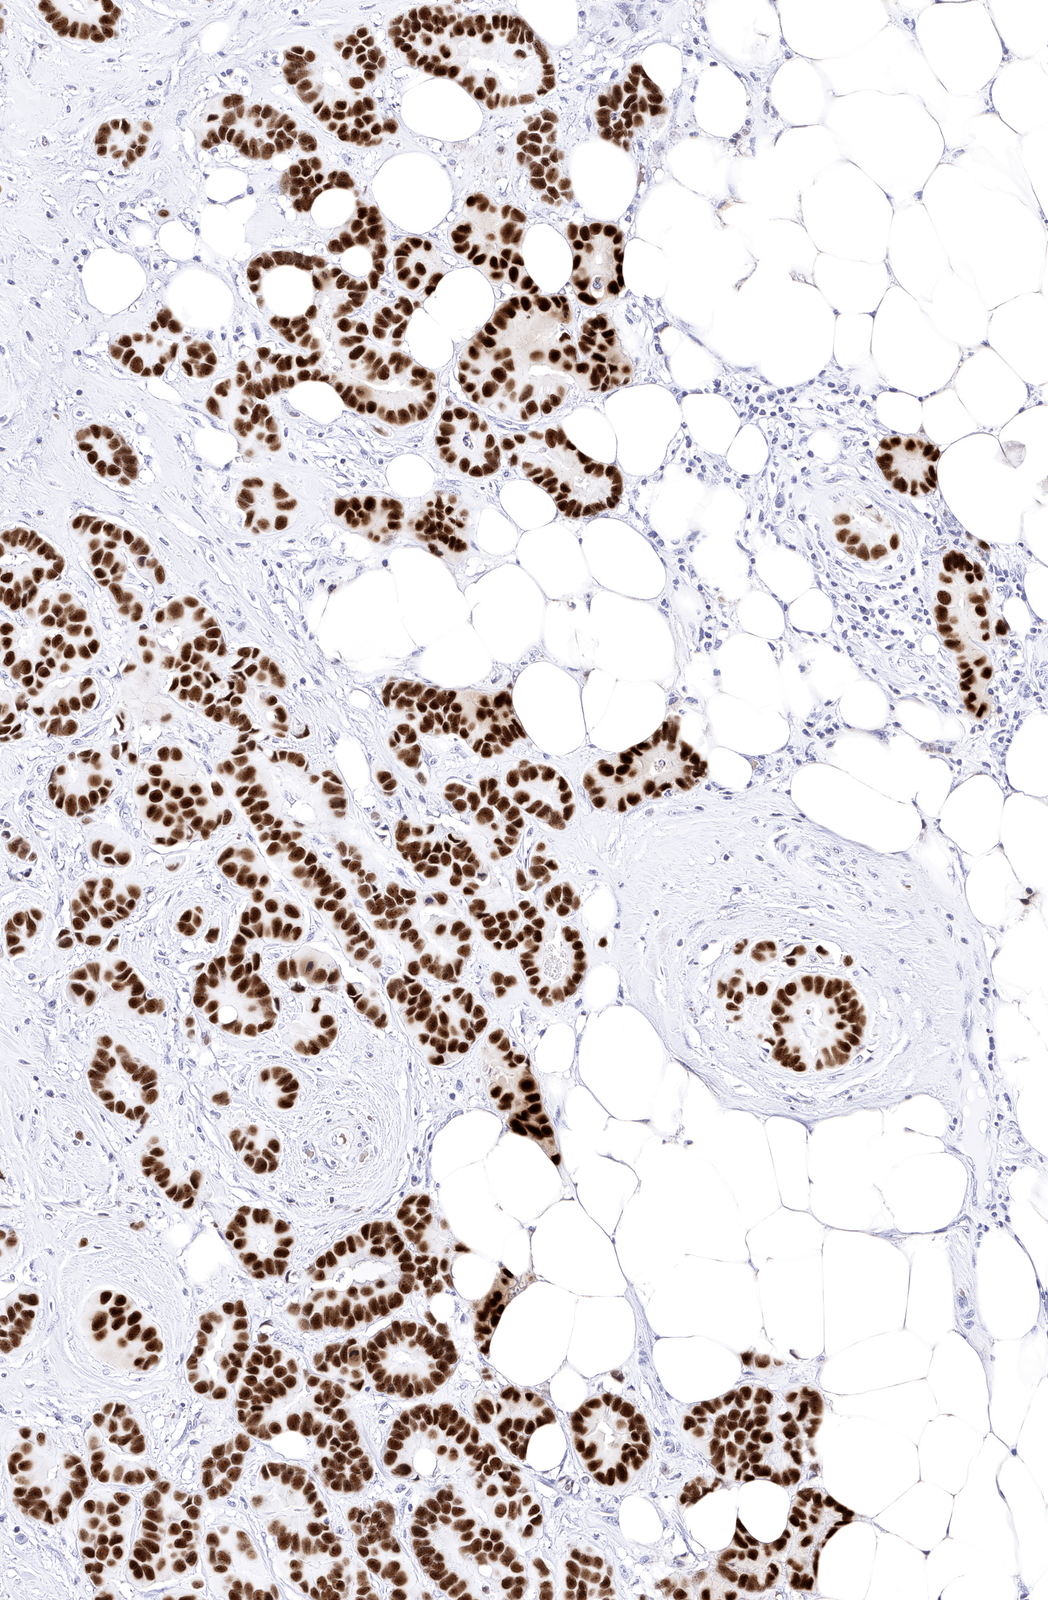
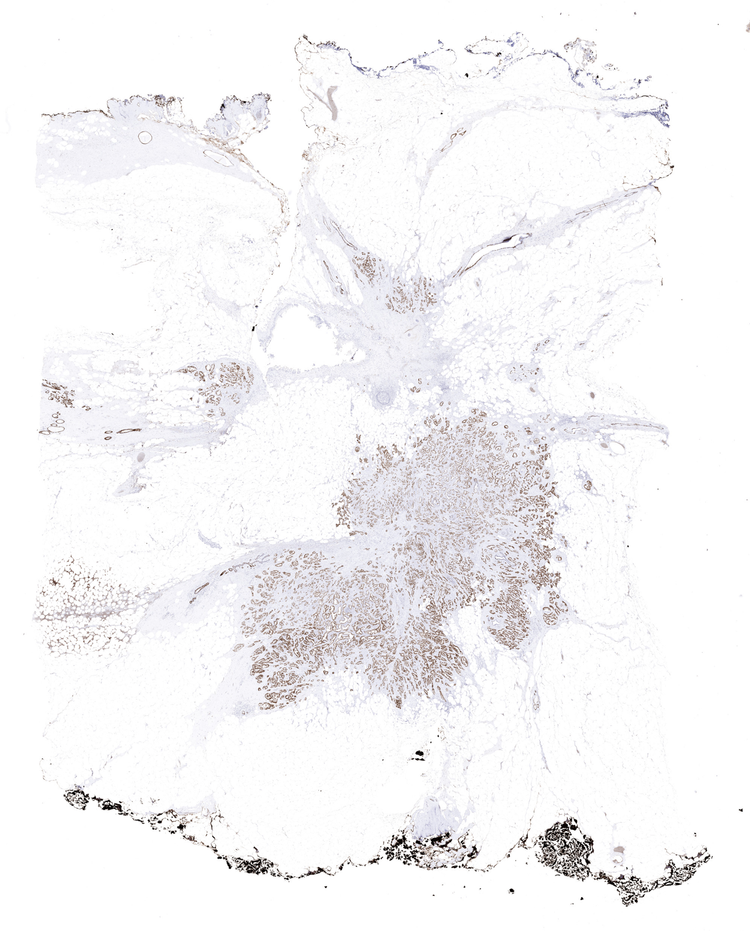
Output
Virtual IHC, generated computationally.
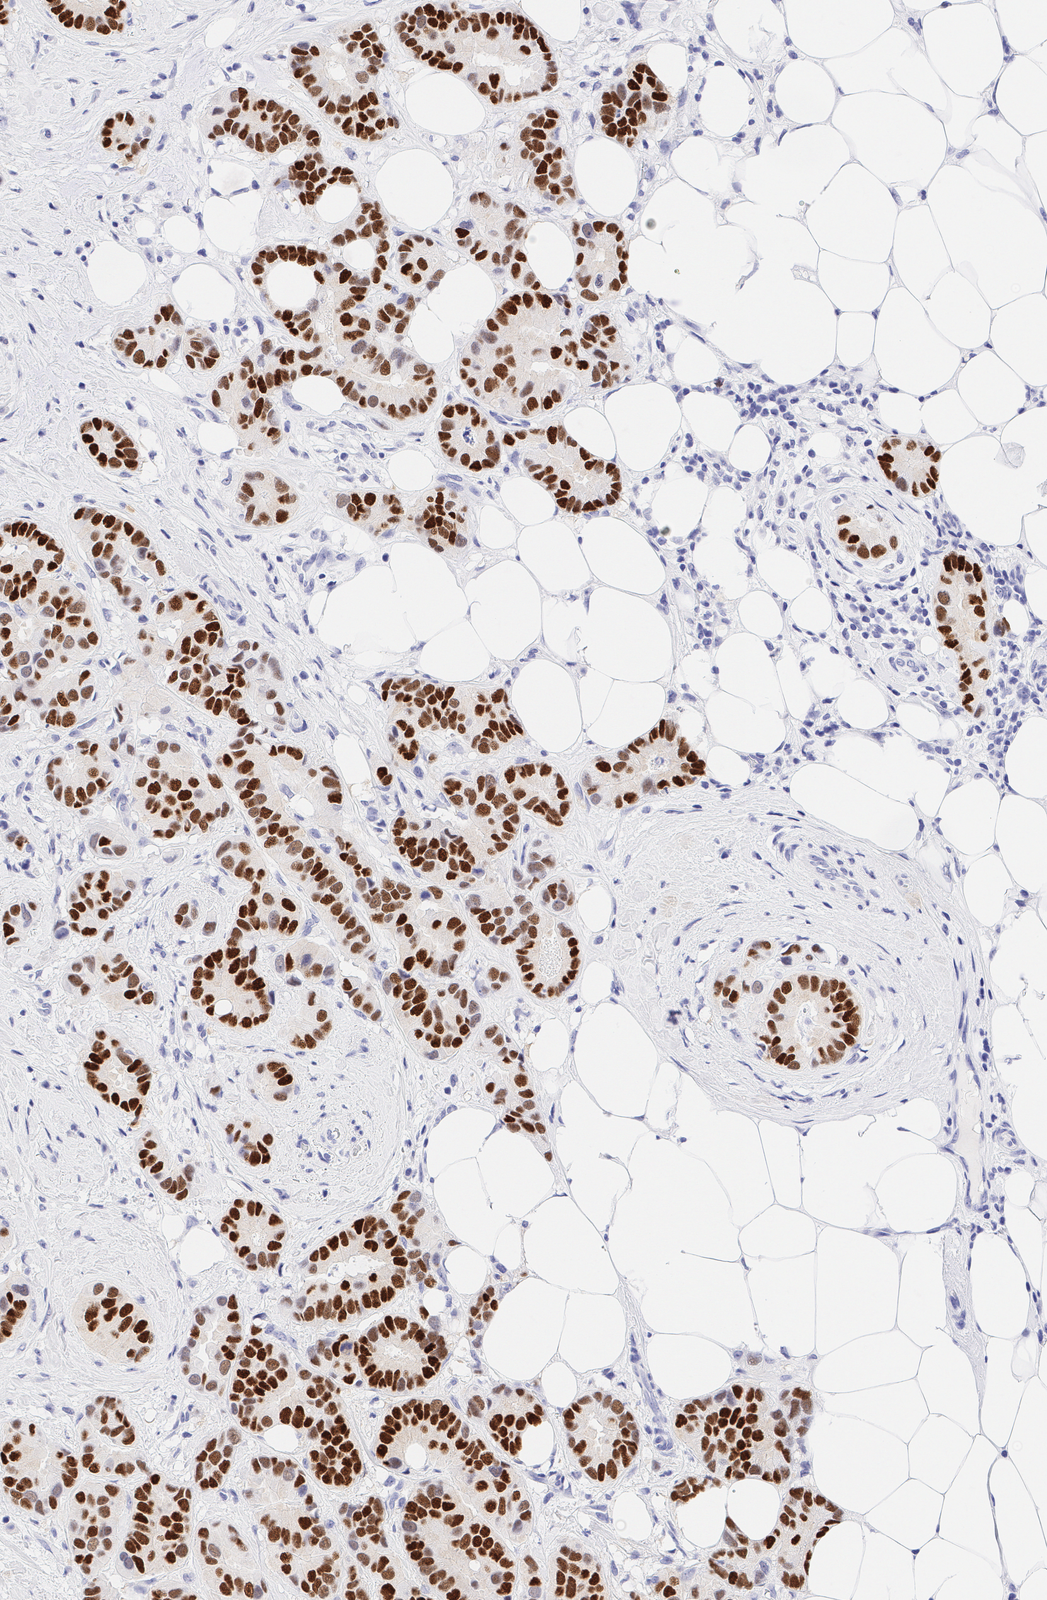
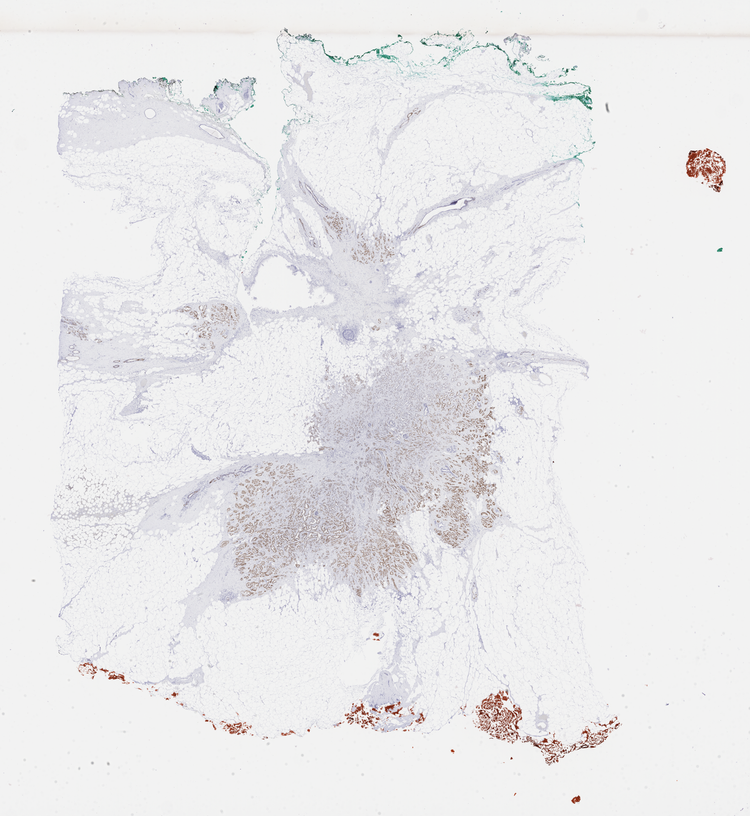
Reference standard
Physical IHC, used as the reference for scoring.
Model performance
0.92
ROC AUC, per cell, across an evaluation set
29.5%
Cell positivity, virtual IHC
148,447
Cells detected
Estrogen Receptor (ER), breast carcinoma · measured across the whole slide
Each virtual biomarker model is evaluated against the corresponding physical IHC stain, which serves as the reference standard.
Model performance is reported using the area under the receiver operating characteristic curve (ROC AUC), a standard metric widely used in diagnostics and machine learning to evaluate a model's ability to distinguish between positive and negative classes.
HOW WE ARE DIFFERENT
We work at the per-cell level, not the case level.

Case-Level Prediction Algorithm
Requires standard H&E or IHC image as input. Returns one result per case.
ViewsML Virtual Staining Algorithm
Requires standard H&E. Generates the IHC image and quantifies expression per-cell, so a single misread cell does not shift the case-level result.
The full comparison
| Case-level prediction | Other virtual staining | ViewsML virtual staining | |
|---|---|---|---|
| Input | Standard H&E whole slide image (WSI) | Standard H&E WSI or unstained tissue captured with an autofluorescence scanner | Standard H&E WSI |
| What it does | Scores the whole case (e.g. risk, prognosis, score) | Generates a new virtual stain image (H&E, special stain, or IHC-like) | Spatially predicts biomarker expression at per-cell level |
| Output | One result per case or slide, with no spatial resolution | A spatial image; per-cell quantification may require a separate tool | A spatially resolved IHC image with per-cell biomarker data |
| Example | Returns one score per case: “High risk of distant metastasis.” | Outputs a new stain image: “IHC-style slide across the section.” | Predicts what cells are expressing, how strongly, and where: “This is a CD8+ T-cell expressing PD-1” |
Case-level prediction
Input
Standard H&E whole slide image (WSI)
What it does
Scores the whole case (e.g. risk, prognosis, score)
Output
One result per case or slide, with no spatial resolution
Example
Returns one score per case: “High risk of distant metastasis.”
Other virtual staining
Input
Standard H&E WSI or unstained tissue captured with an autofluorescence scanner
What it does
Generates a new virtual stain image (H&E, special stain, or IHC-like)
Output
A spatial image; per-cell quantification may require a separate tool
Example
Outputs a new stain image: “IHC-style slide across the section.”
ViewsML virtual staining
Input
Standard H&E WSI
What it does
Spatially predicts biomarker expression at per-cell level
Output
A spatially resolved IHC image with per-cell biomarker data
Example
Predicts what cells are expressing, how strongly, and where: “This is a CD8+ T-cell expressing PD-1”
A GROWING LIBRARY
Access a growing library of biomarkers.
Our library of validated virtual biomarkers is continually expanding to cover more biomarkers, disease areas, and indications, enabling richer multiplex and co-expression analysis. Each biomarker undergoes its own large-scale training process across one or more tissue types, and is validated against pathologist-scored IHC reference standard.
30+
Virtual biomarker models
9
Tissues
1 Billion
Annotated cells
GET STARTED
See virtual staining on your own tissue.
Send us one H&E whole slide image. We return the virtual IHC alongside it.
Tell us
The marker and tissue you are working on.
Send
One H&E whole slide image.
Review
Walk through the virtual IHC with our team.